@AnthonyMasure
University Toulouse – Jean Jaurès, lab. LLA-CRÉATIS (France) / HEAD – Geneva
From Semiology of Graphics to Cultural Analytics: flaws in the mathematization of visible
18 July 2019, Tokyo, International Cartographic Conference (ICC)
Chair T33 « Design and visual variables: Rethinking Jacques Bertin »,
lead Anne-Lyse Renon
1 —
Design?
“Everything that has transpired has done so according to my design”
Emperor Palpatine alias Dark Sidious 👽 in Star Wars, épisode VI, 1983
“Everything that has transpired has done so according to my design”. In French: “Tout se passe à présent comme je l’avais prévu.”
Design, in English, means what fits into a plan

Possibly negative connotation of the English word “Design”
Emperor Palpatine (Ian McDiarmid) VS Dark Sidious
Several “Design”!
Industrial design, Product design, Graphic design, Space design, Fashion design, Web design, Interface design, etc.
2 —
Previous works
Member of the Board of Jacques Bertin’s restrospective, lead A.-L. Renon, EHESS, 2017

Cofunder of the research journal Back Office (graphic design & digital practices)
Issue #2, « Thinking, Displaying, Classifying », Fork / B42 ed., 2018
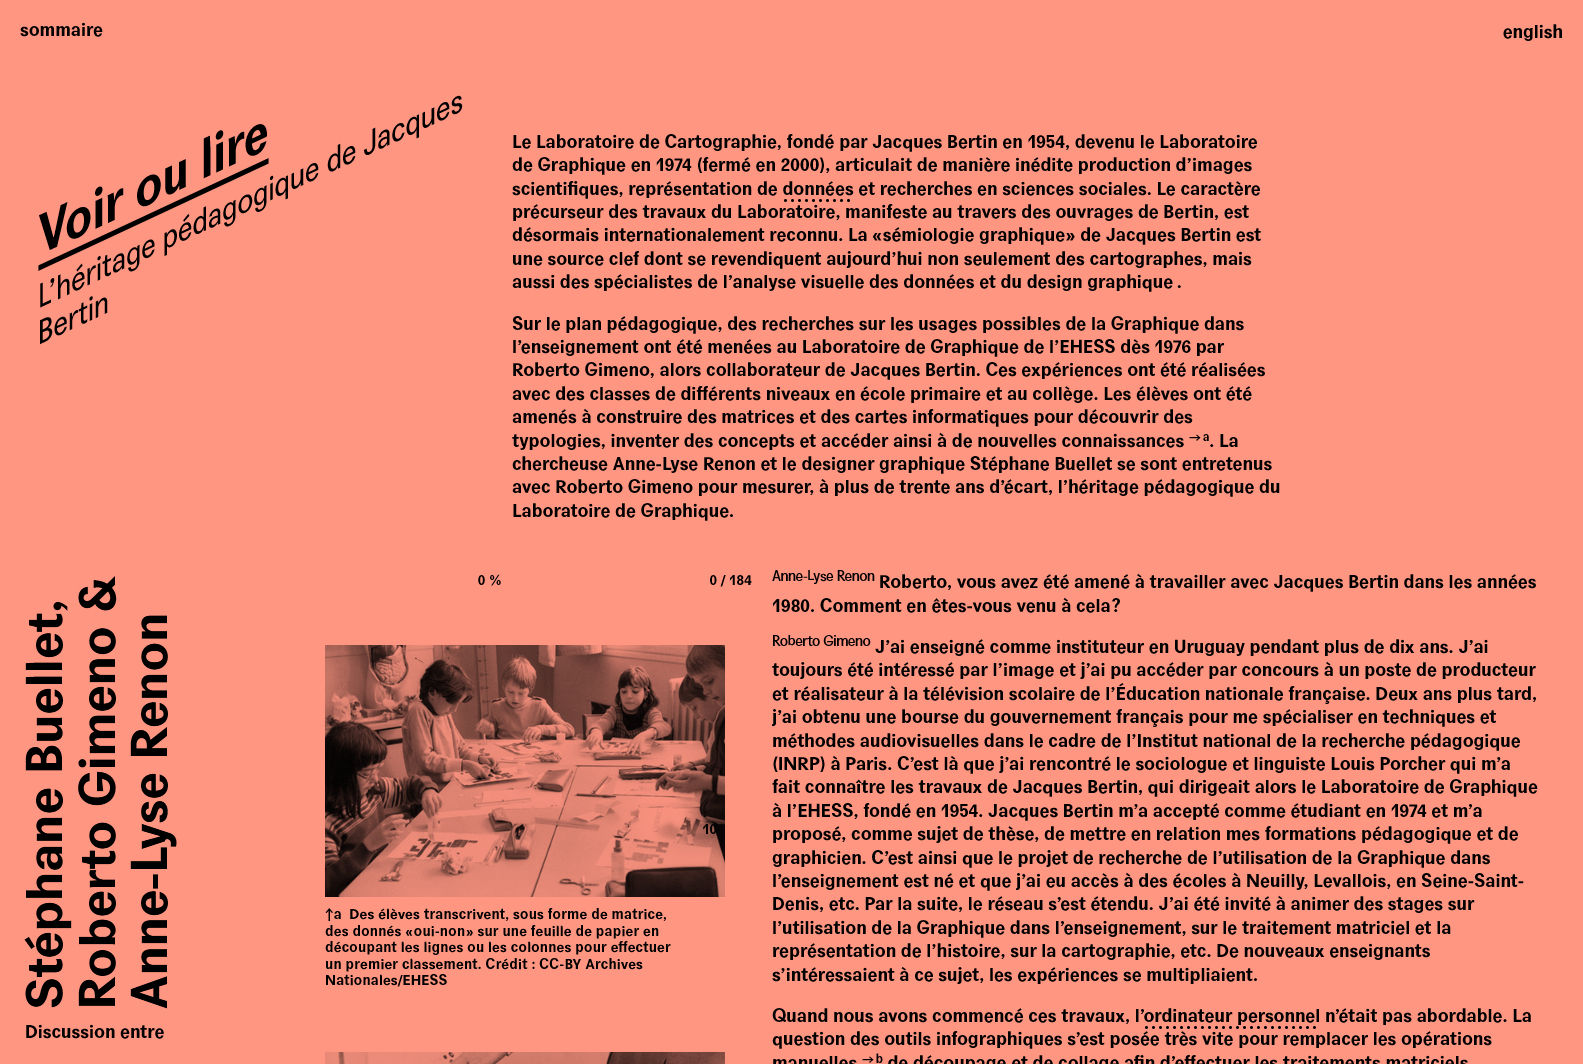
“To See or to Read: the pedagogical legacy of Jacques Bertin”, Back Office, issue 2, 2018
Lecture at University of Strasbourg (France), dir. Anne-Lyse Renon and Catherine Allamel-Raffin, 17-18 December 2018
3 —
Main questions
Design & Bertin legacy
- Why can Bertin still be of interest to graphic designers?
- Clarify the links between the “claim to objectivity” of mapping and the “rationality” of digital programs
- Study Jacques Bertin’s work (i.e. with IBM) and his influence on dataviz and Cultural Analytics
- What wider implications can graphic Semiology of Graphics have in digital environments?
Abstract
The goal of this lecture is to study the legacy of Jacques Bertin’s Semiology of Graphics (1967) in design & dataviz, and more precisely in Lev Manovich’s Cultural Analytics (2007).
4 —
Mapping as a model of vision and computation

Henri Desbois, Associate professor of Mapping, University Paris Nanterre (France)
“Science [of the 19th century] applies to objects that exist outside people who observe them and about which it is possible to state truthful (in the form of relationships) properties (in the sense of verifiable) independently of the observers.”
— Henri Desbois, “L’œil et la toise : l’objectivité cartographique du 18e à nos jours”
“What we call objective reality is, in the final analysis, what is common to many thinking beings, and could be common to all: this common part, we will see, can only be harmony expressed by mathematical laws.”
— Henri Poincaré, La valeur de la science, 1905
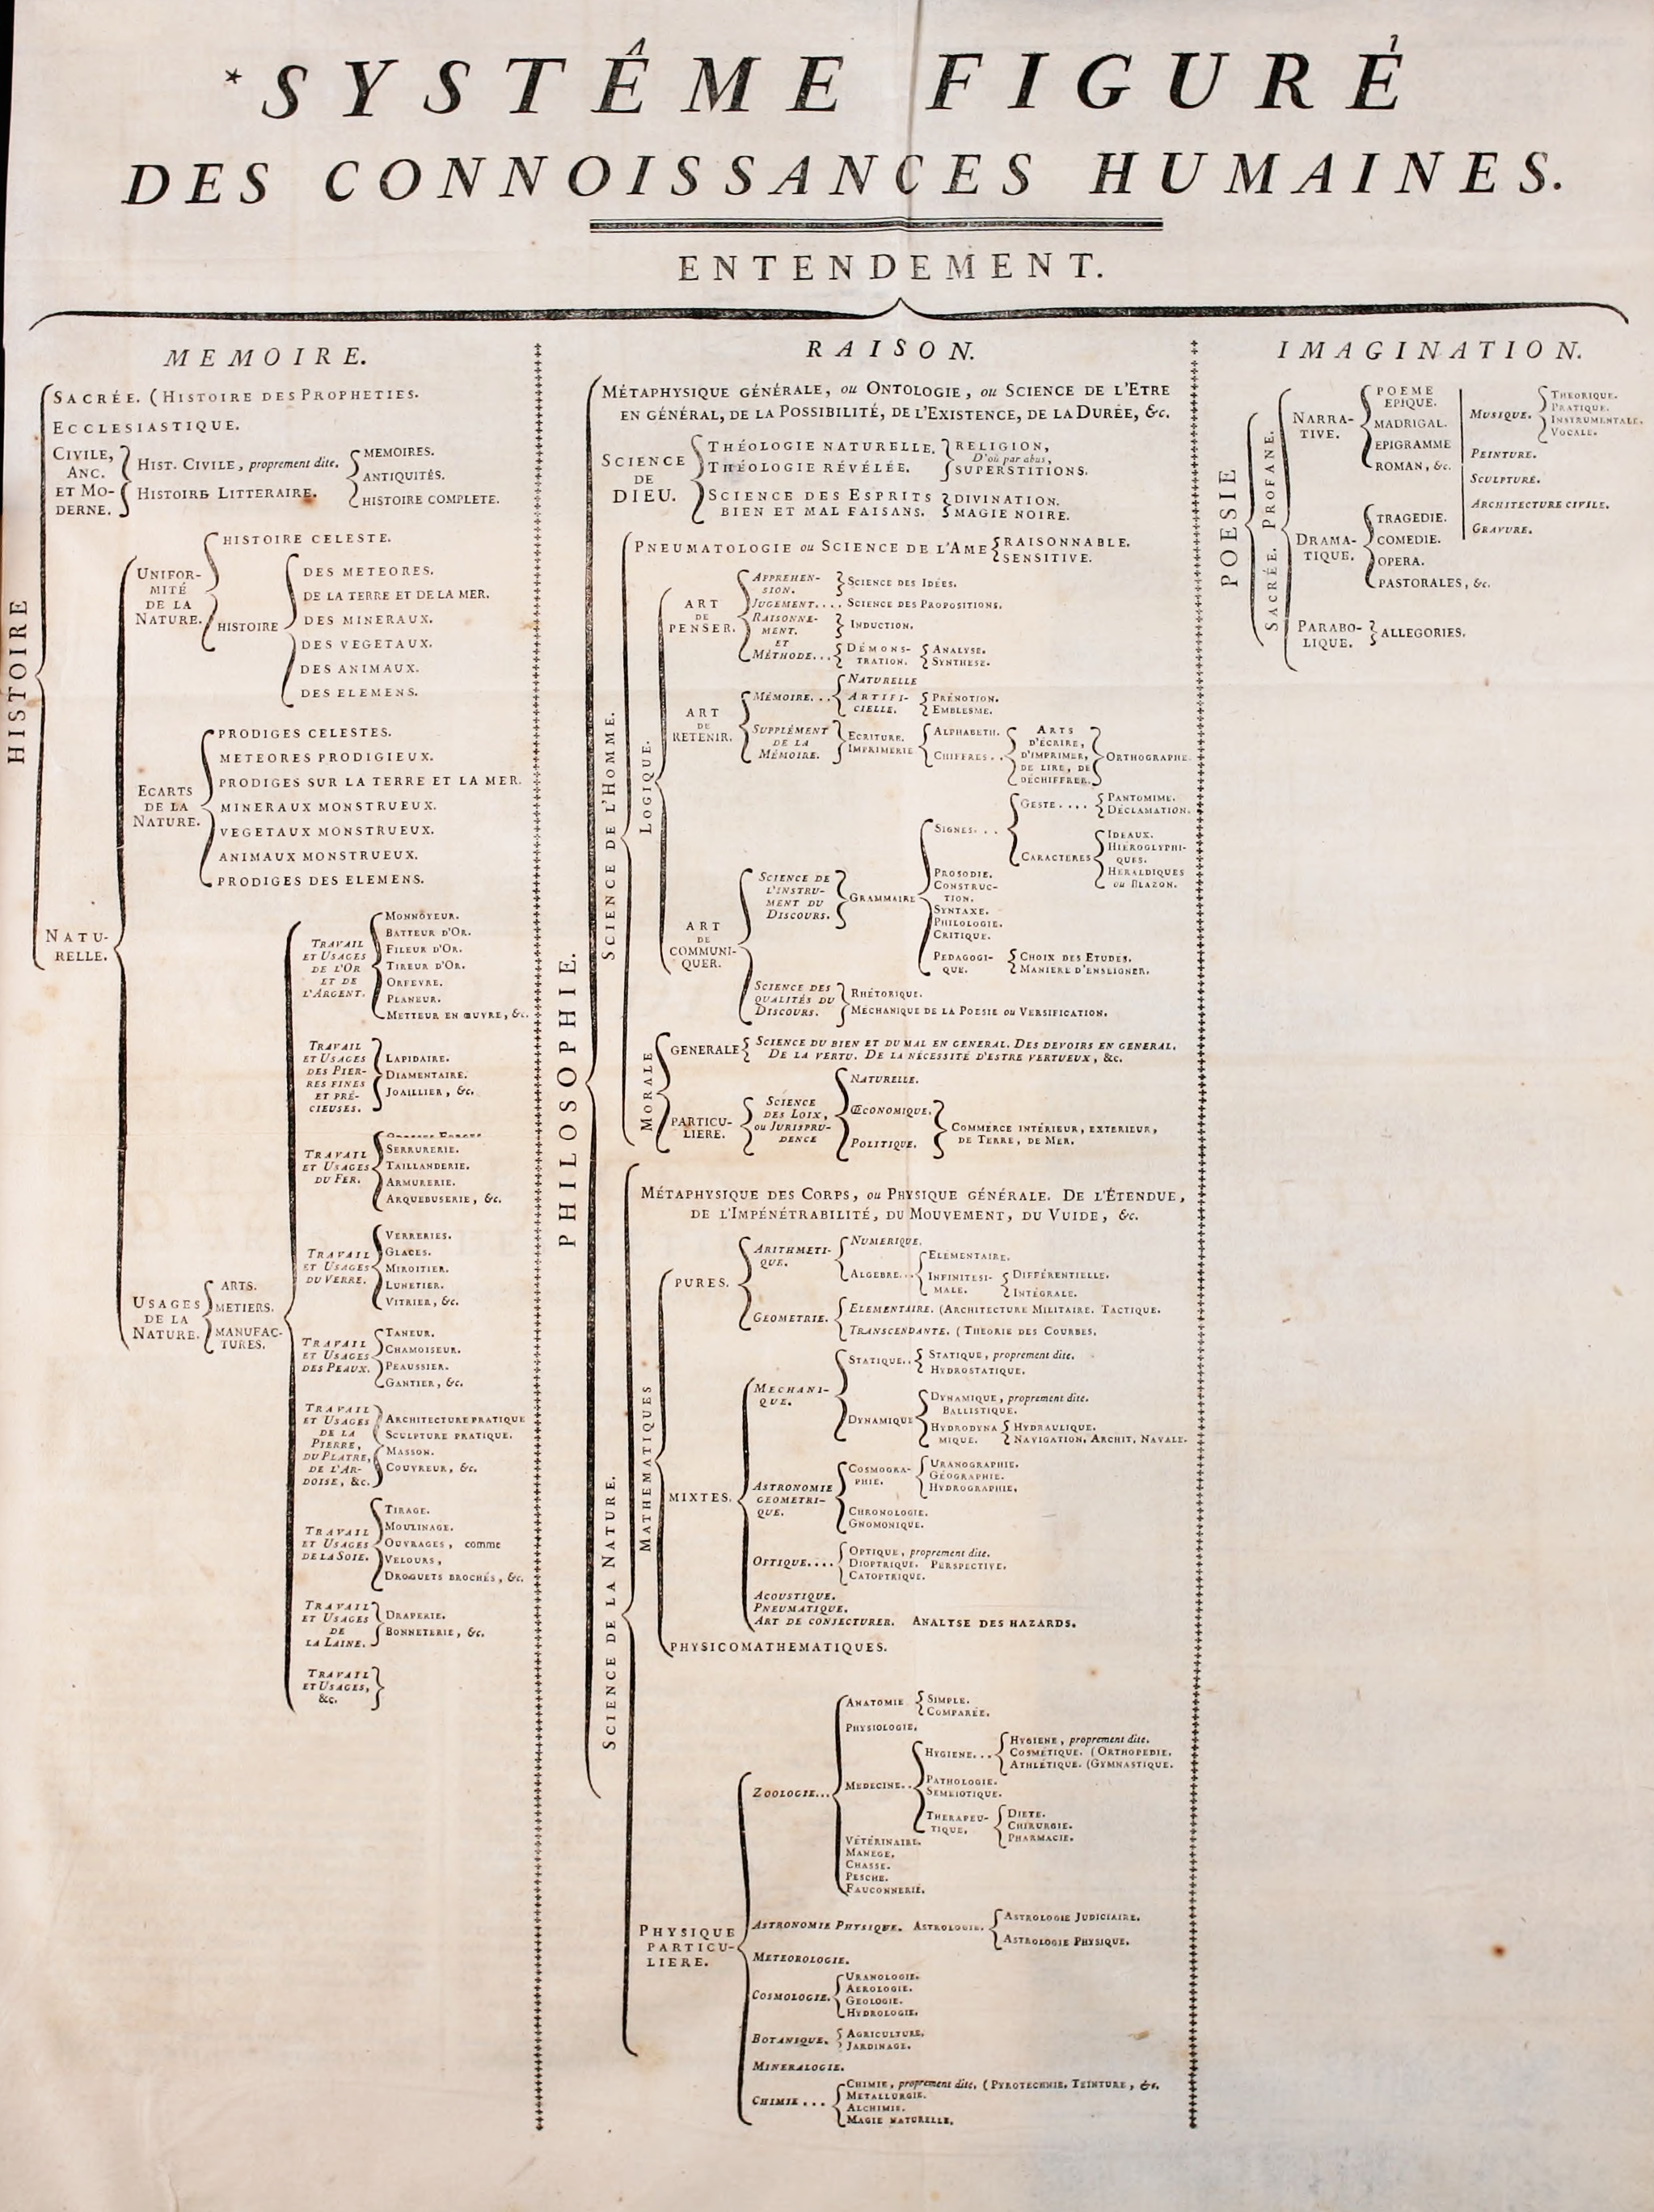
Jean D’Alembert, “Figurative system of human knowledge,” 1751.
Map as method of displaying knowledge
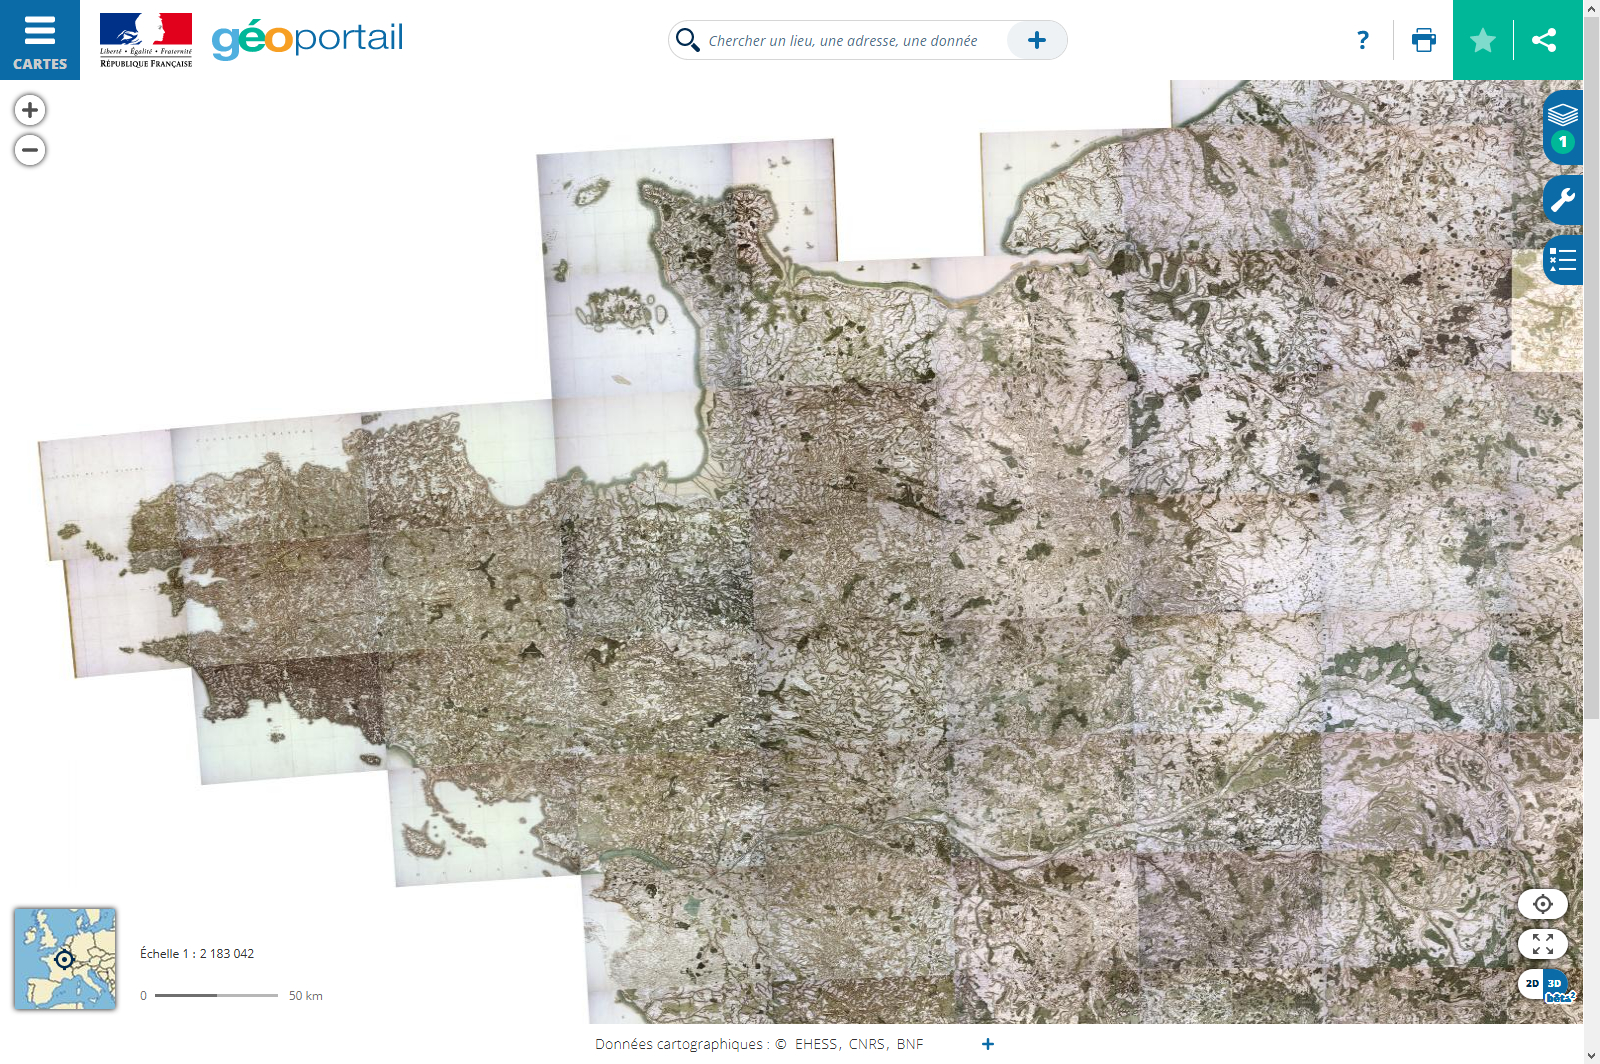
“Map of Cassini” (or “Map of Academy”), 1750-1815. According to Desbois, individual human judgment should be reduced as much as possible
“La carte d’État-major” of the 19th century, 978 drawings, Paris, Grand Palais, 2012 : Military map and “trivialization” of the computation
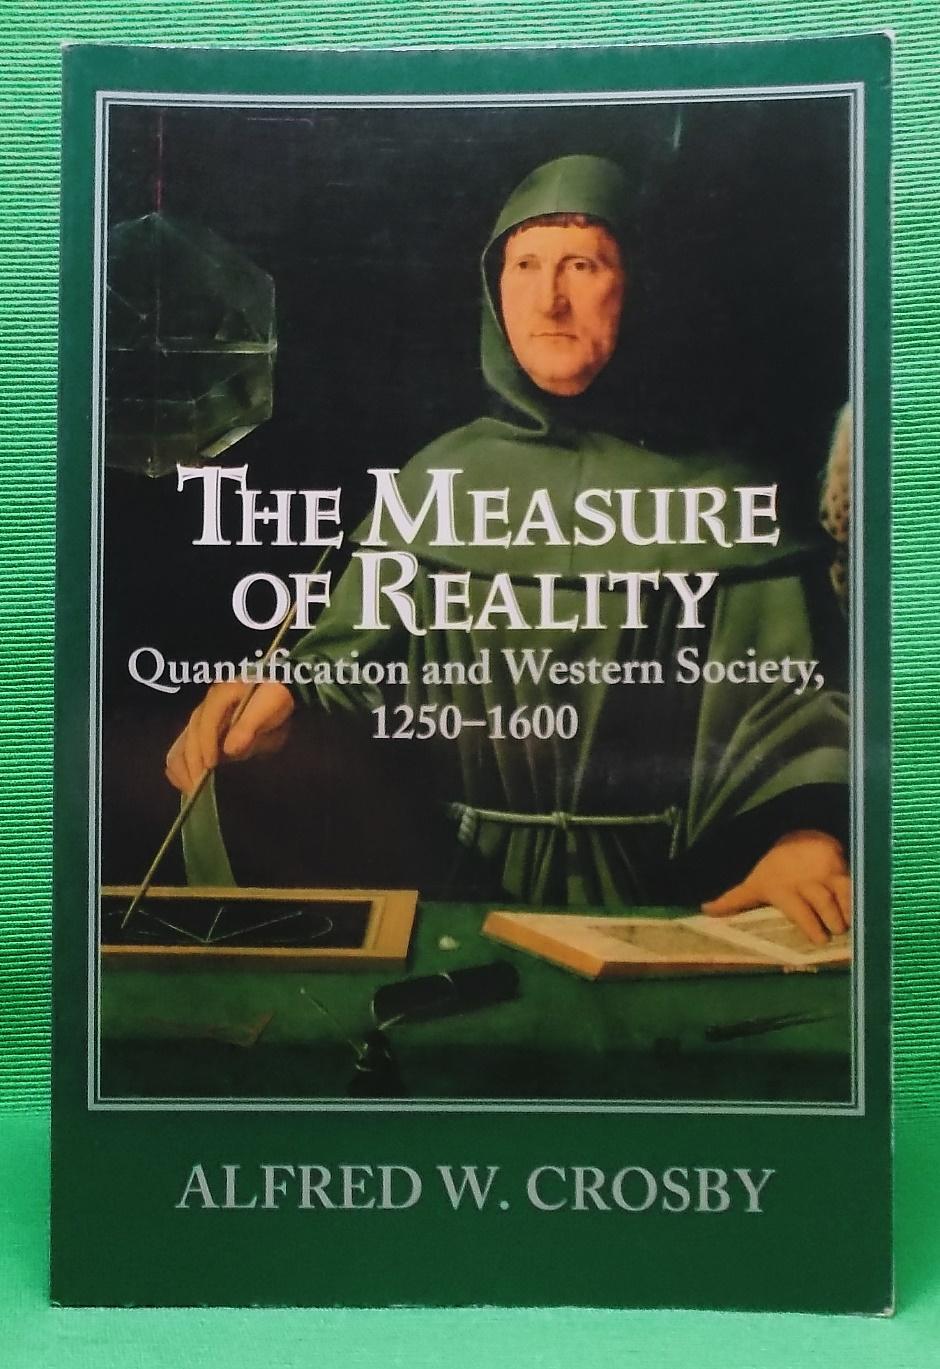
A. W. Crosby, The Measure of Reality: Quantification in Western Europe (1250–1600), 1997: “How and why did it come to pass that Europeans, seemingly backward bumpkins in medieval times, became so successful as imperialists?”
5 —
From Jacques Bertin’s Semiology of Graphics to dataviz
5.1 —
Jacques Bertin’s Laboratoire de Graphique (1954-2000)
Jacques Bertin (1918–2010)
Gilles Palsky, « La Sémiologie graphique de Jacques Bertin a cinquante ans ! », 2017
Jacques Bertin
- Publication of Semiology of Graphics in 1967
- Cartography as a scientifically proven system of signs (the “visual variables”)
- Primacy of effective communication over accuracy (prior simplification of information)
- This mapping “doxa” has greatly influenced cartographers since the 1970s
“Il importe donc de définir un critère précis, mesurable, à partir duquel on puisse classer les constructions, définir incontestablement la meilleure et expliquer, s’il y a lieu, pourquoi certains lecteurs préfèrent une construction et certains une autre. Nous appellerons ce critère ‹ l’efficacité ›. […] Si pour obtenir une réponse correcte et complète à une question donnée, et, toutes choses égales, une construction requiert un temps d’observation plus court qu’une autre construction, on dira qu’elle est plus efficace pour cette question.”
— Jacques Bertin, Semiology of Graphics, 1967
5.2 —
From Bertin to dataviz
Ben Fry, Computational Information Design, MIT, PhD in Media Arts & Sciences, 2004
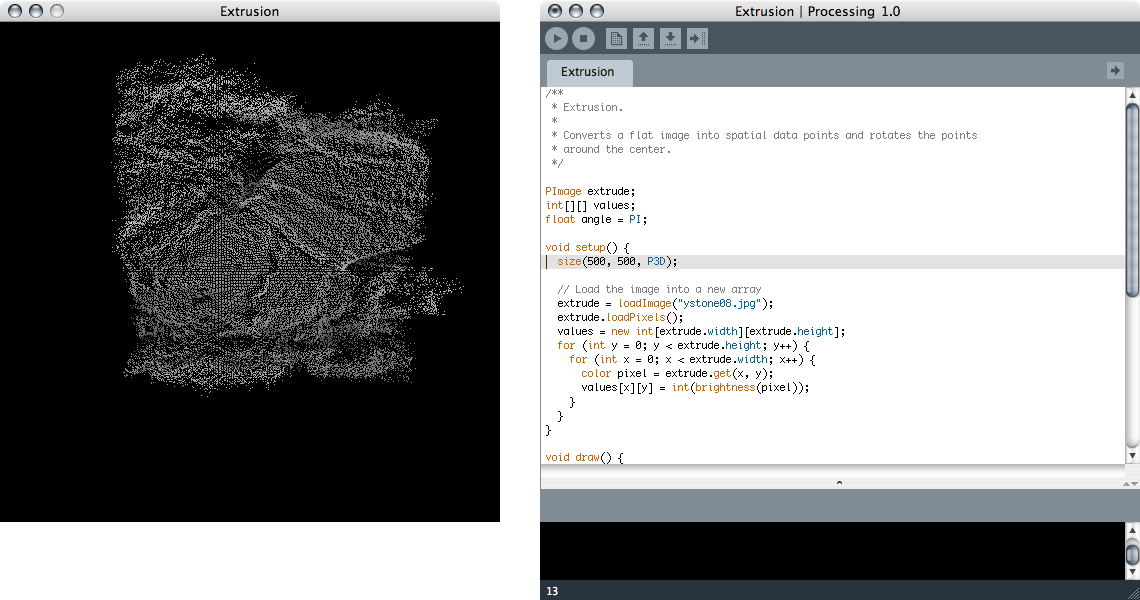
Processing 1.0 IDE Mac OS, 2001
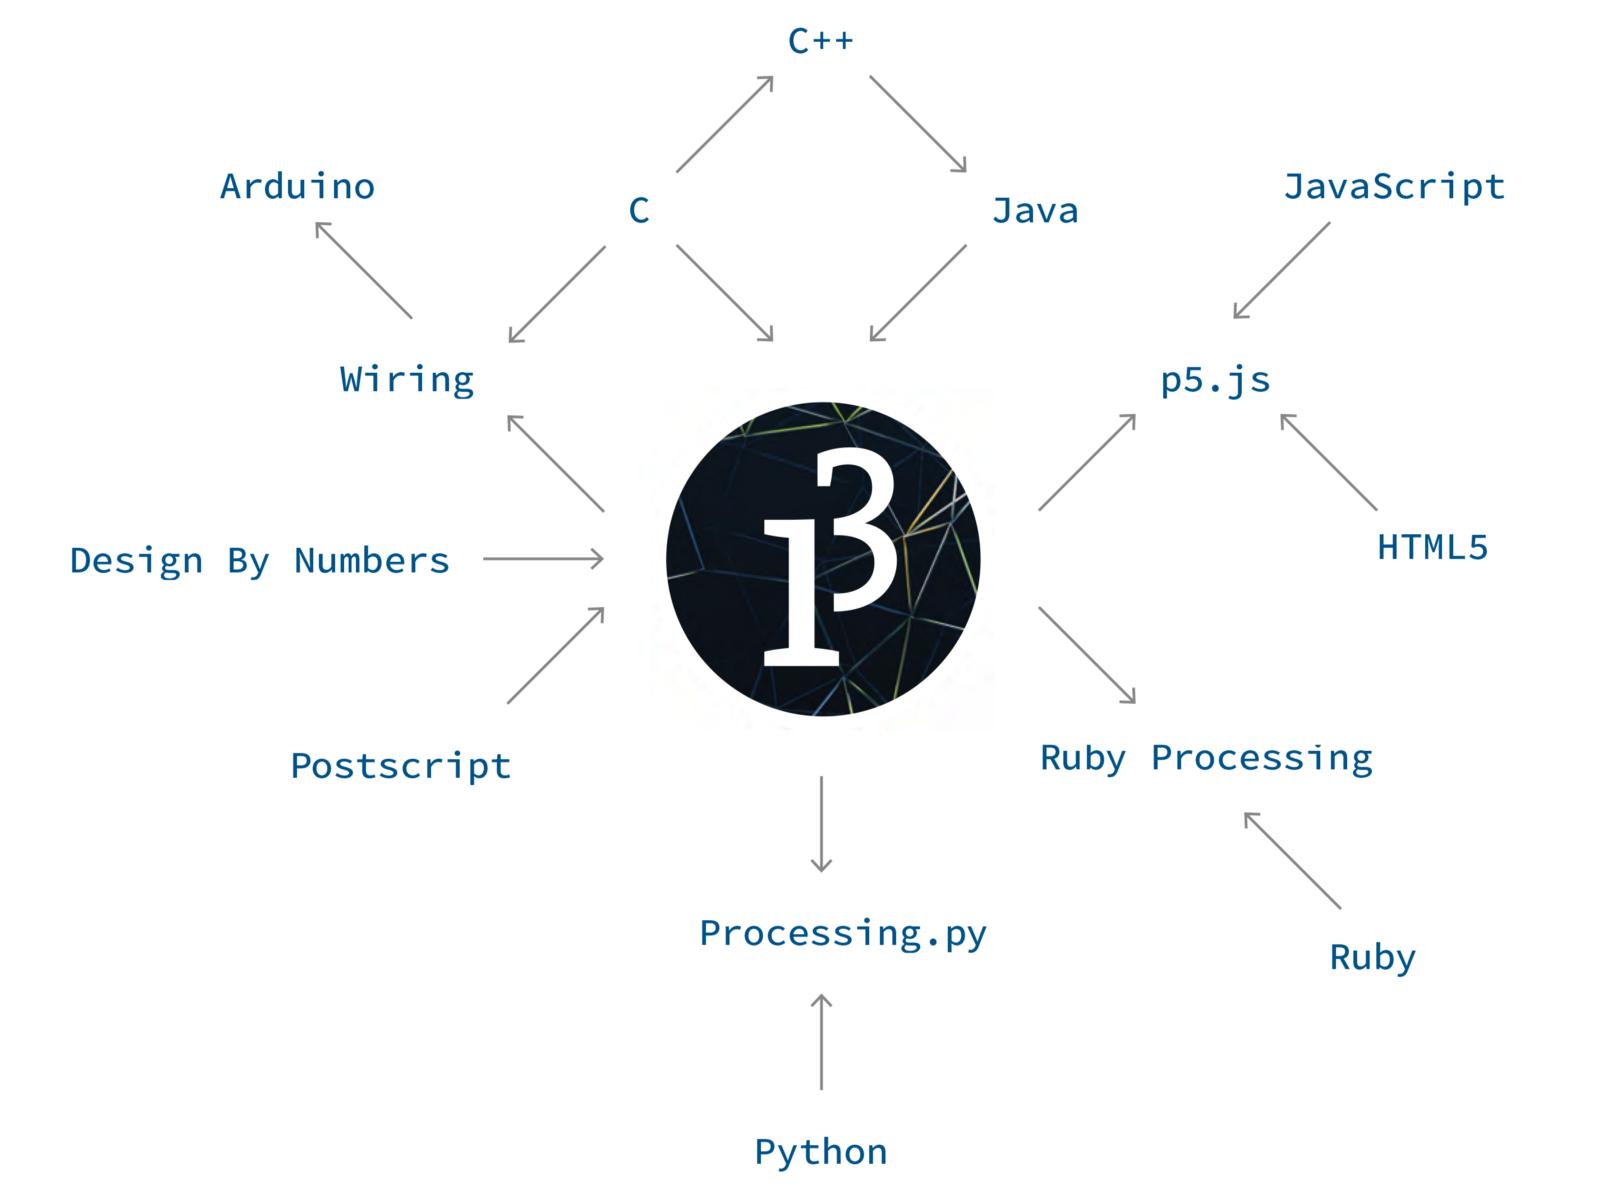
Casey Reas, Ben Fry, “A Modern Prometheus”, 2018
From dataviz to Cultural Analytics
Processing, as a standardized and accessible language for building visual elements, opened the way to new fields, such as Cultural Analytics.
6 —
Cultural Analytics: a schematization of cultural works

Lev Manovich (1960–)
Lev Manovich, The Language of New Media, 2001
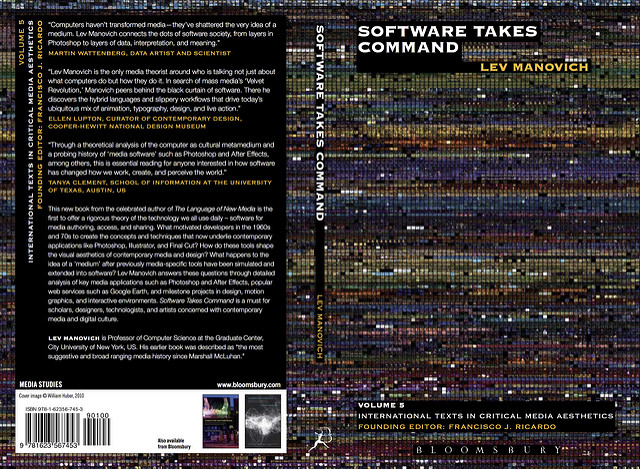
Lev Manovich, Software Takes Command, 2013
Website of Cultural Analytics Lab (2007)
« Cultural Analytics is an open-access journal dedicated to the computational study of culture. Its aim is to promote high quality scholarship that applies computational and quantitative methods to the study of cultural artifacts (text, image, sound) at significantly larger scales than traditional methods. […] In combining the very best of the humanities and the social and computational sciences, Cultural Analytics aims to challenge disciplinary boundaries and serve as the foundational publishing venue of a major new intellectual movement. »
— Journal of Cultural Analytics, 2016
Lev Manovich (lead), Phototrails / Instagram Cities, 2012-2015
Lev Manovich (lead), Selfie City, 2014
Lev Manovich, “Introduction to Cultural Analytics,” unpublished ITW, 2016
“The ultimate goal of Cultural Analytics should be to map and understand in detail the diversity of contemporary professional […], i.e. to focus on what is different between numerous artifacts and not only on what they share. […] Today I can use any computer to map and visualize thousands of differences between tens of millions of objects. We do not have an excuse any more to only focus what cultural artifacts or behaviors share, which is what we do then we categorize them, or perceive them as instances of general types. So while we may have to start with extracting patterns first just to draw our initial maps of contemporary cultural production and dynamics given its scale, […] we focus only on the differences between individual objects.”
— Lev Manovich, “Introduction to Cultural Analytics,” 2016
Christian Fauré, “Digital Studies (2) : Cultural Analytics”, 2011
Fauré explicitly compares Cultural Analytics to Bertin!
Conclusion —
Rethinking dataviz & Cultural Analytics through visible variables
—
Dataviz without visual variables
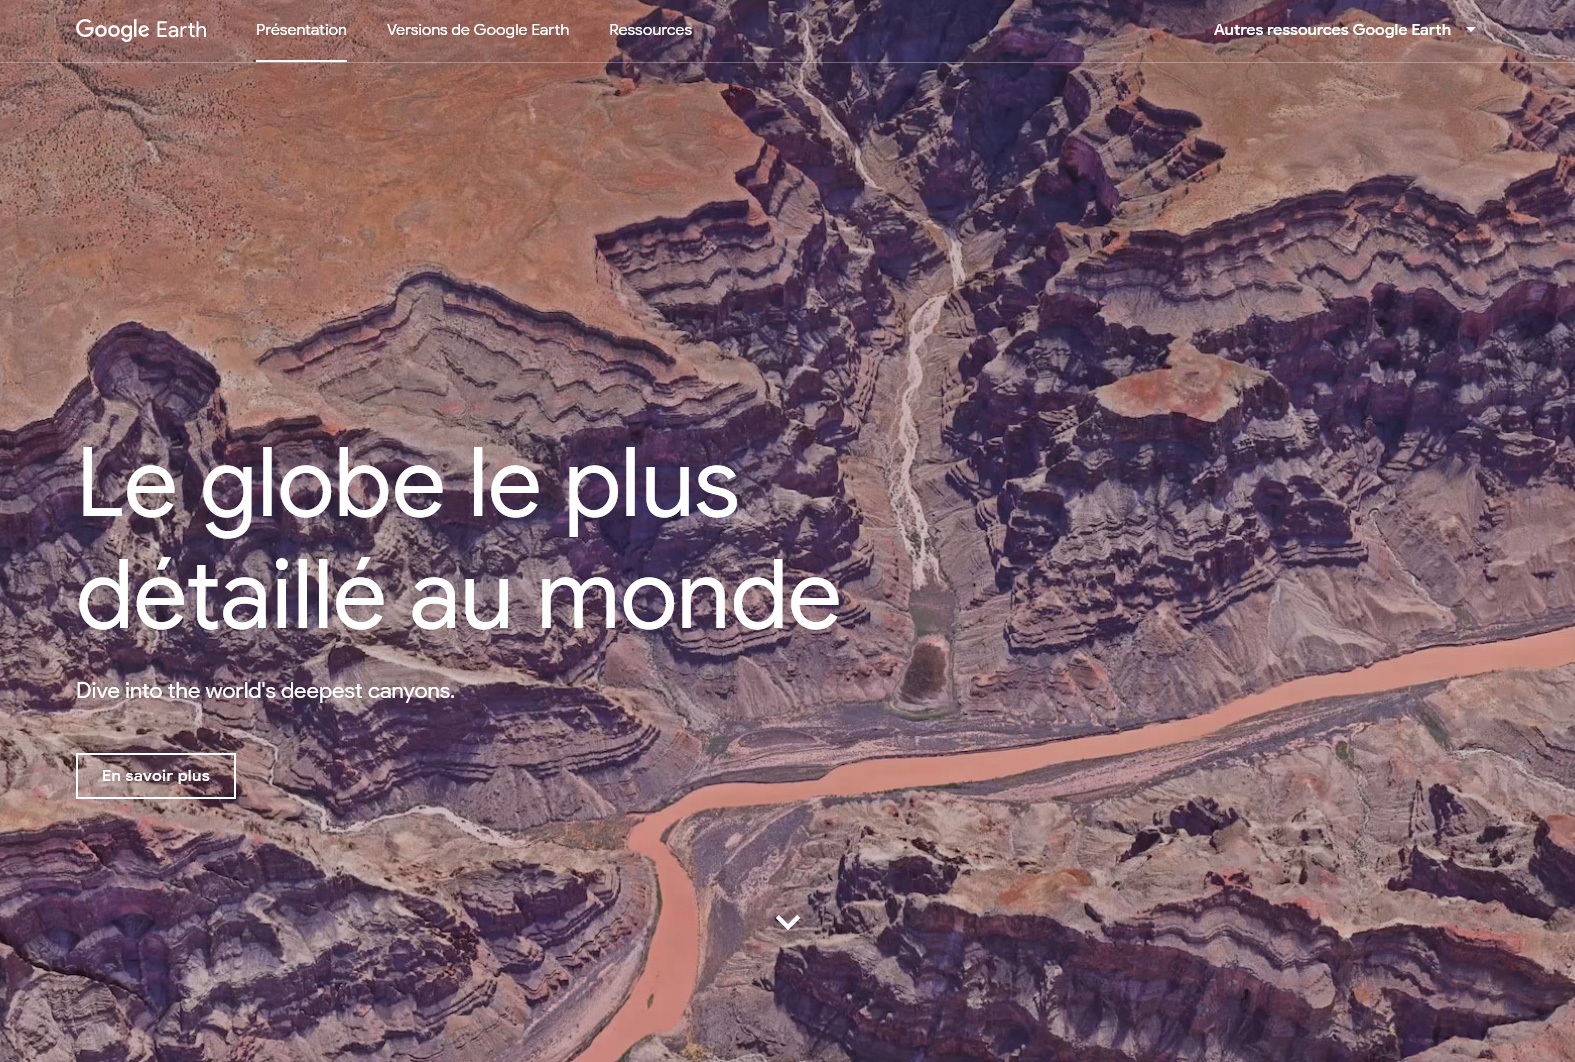
Google Earth (2018), enhanced version of cartographic objectivity
« Watch Dogs website maps your unprotected social data », Wired, 2013
—
Beyond visible variables?
Semiology of Graphics and Cultural Analytics
- Persistence of the overhanging viewpoint of 18th century cartography in contemporary graphic environments
- Need to deconstruct the objectivity of mapping (John Brian Harley, 1989)
- Cultural Analytics and Semiology of Graphics: art or science?
“As they embrace computer-assisted methods and Geographical Information Systems, the scientistic rhetoric of map makers is becoming more strident. The ‘culture of technics’ is everywhere rampant.”
— John Brian Harley, “Deconstructing the Map,” 1989
From mathematical laws to mathematical flaws
- How to reveal the flaws in the mathematization of visible?
- What about a “located” data visualization (Donna Harraway)?
- Is it possible, or even desirable for cultural productions, to be “scientifically objective”?
—
Looking forward: from topological mapping to information design

Google Material Design (2014–)
Rethinking Bertin
- Are visual variables still relevant in digital environments?
- Are Google Material Design the new visual variables?
@AnthonyMasure
www.anthonymasure.com
—
Slides powered by Reveal.js, MIT License
Typefaces: IBM Plex, Mike Abbink for Bold Monday, 2018
Acknowledgements: Anne-Lyse Renon, Takashi Morita and the ICC Tokyo team
—
Content licensing (excluding images): CC BY–SA